Kaggle started releasing publicly available data on their website for people to analyse, visualize, and to explore the insights. We can also post our findings, scripts and plots for other people to see and comments. At the same time, we also learn a lot from other’s posts. Recently, they published a dataset called “Climate Change: Earth Surface Temperature …” which has global temperature data since 1750. You can get the data here
Looking at the dataset, I got an urge to see temperature data specially for Indian cities. Imagine, we got a data for almost 200 years
of average temperature of all the major cities of the World. Immediately, I filtered the country option to India and started exploring.
First, I thought of ploting the average temperature of all cities on the map, but looking at the data, almost all the cities which clustered
in the same region gives similar average temperature. So ploting on the map won’t give a satisfactory overview. Another option was to create
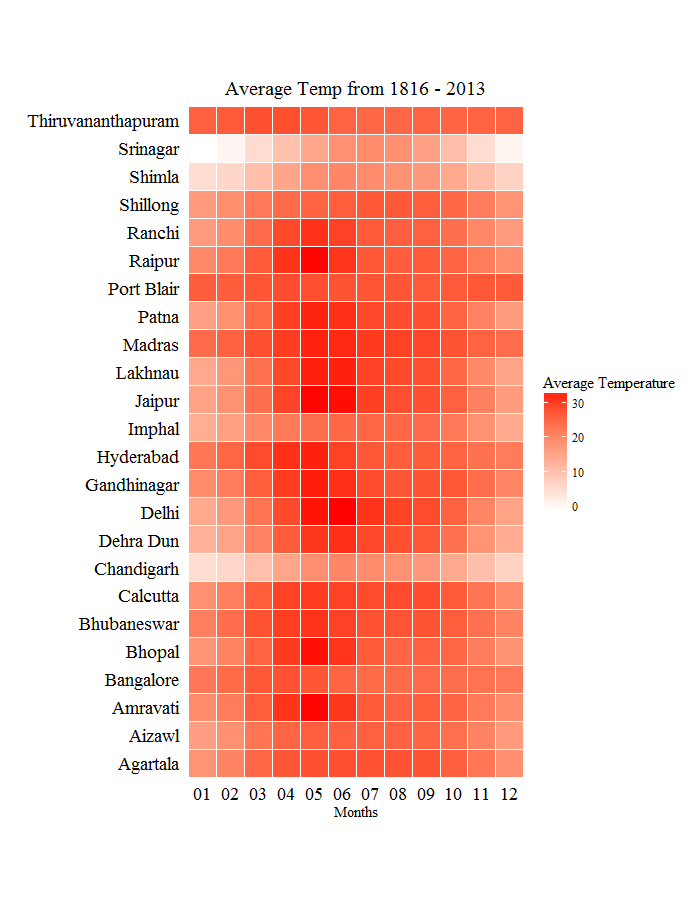
a heatmap of cities with monthly average temperature over the period of 200 years. Heatmap can show us how different cities average
temperature vary monthly. Instead of listing all the cities, I selected only few, mostly capitals of the states. Here’s the heatmap.
To recreate this heatmap, get the code on github
Or, you can check on kaggle