Fertility data is available on Govt. census portal, but I have never tried to look at it until this article was published on kanglaonline. Some of the comments rejected the claim made by the article. Since the article is not supported by data, the claim made by the article is weak as per some of the comments. I have some female friends who got married at early 30’s and some of them did have some problem conceiving and some of them didn’t have any problem. I didn’t know the infertility problem is at large scale in my state - Manipur. I will not know the causes of infertility as pointed by the article which says it may be because of many factors which include our food habit like eating fermented fish and dried fish. If we look at the present situation, not just infertility, overall health is impacted because of food adulteration, all type of pollutions and stressfull lifestyle. What I can know is how large the infertility problem is in Manipur. So I thought of looking at the 2011 census data on fertility. At least, data will show some insights. I will compare fertility data of Manipur with some other states with almost equal women population. This way we will know where Manipur stands in fertility compare to these states. I found women population of Nagaland, Meghalaya and Tripura share the number closer to Manipur’s women population than any other state. Nagaland’s women population is less than Manipur’s while Meghalaya’s and Tripura’s women population are more.
Here is the filtered table of four states from 2011 census data -
| State | Total women | Total married women | Total married women with no Child |
|---|---|---|---|
| Manipur | 14,17,208 | 6,87,039 | 1,18,454 |
| Nagaland | 9,53,853 | 4,00,850 | 56,482 |
| Meghalaya | 14,75,057 | 6,57,702 | 1,11,646 |
| Tripura | 17,99,541 | 10,78,931 | 1,25,235 |
We can check the difference of ‘Total married women’ and ‘Total married women with no child’ for each state by percentage. This will tell us which state is highest in fertility rate and which state is not. We simply do
% of Total married women = Total married women / Total women
% of Total married women with no child = Total married women with no child / Total married women
Here is the calculated percentage table -
| State | % of married women | % of married women with no child |
|---|---|---|
| Manipur | 48.47 | 17.24 |
| Nagaland | 42.02 | 14.09 |
| Meghalaya | 44.58 | 16.97 |
| Tripura | 59.95 | 11.60 |
From the above table, we can easily point out that percentage of married women with no child in Manipur is highest among the four states which do inform us that infertility is indeed high in our state. Lets break down the data further by age group for all the states. The original data categorized the ages of women into few age categories like “less than 15”, “15-19”, “20-24” and so on. It’s understandable if a married woman whose age is less than 20 years doesn’t have a child. So better to check the number of women whose age is 20 years and above with no child. Again, we cannot conclude entirely these total number of childless married women is by-choice childless or not, specially younger married women. Lets see the table first to understand better. The columns from Age to 0 child is from the original data. I have added two new columns % of married women and % of married women with no child for each age interval like I have done in the above table. I have also rounded the decimal points on percentage.
Breakdown of data by age intervals for Manipur
| Age | Total women | Married women | 0 child | % of married women | % of married women with no child |
|---|---|---|---|---|---|
| 20-24 | 1,42,195 | 55,076 | 22,944 | 39 | 42 |
| 25-29 | 1,37,589 | 88,096 | 22,061 | 64 | 25 |
| 30-34 | 1,11,276 | 89,116 | 14,723 | 80 | 17 |
| 35-39 | 1,00,434 | 89,275 | 10,888 | 89 | 12 |
| 40-44 | 84,933 | 78,913 | 8,424 | 93 | 11 |
| 45-49 | 73,113 | 69,659 | 6,688 | 95 | 10 |
| 50-54 | 59,679 | 57,615 | 5,035 | 97 | 9 |
| 55-59 | 44,090 | 42,886 | 3,758 | 97 | 9 |
| 60-64 | 35,330 | 34,315 | 3,468 | 97 | 10 |
| 65-69 | 23,430 | 22,680 | 2,460 | 97 | 10 |
| 70-74 | 17,477 | 17,056 | 2,081 | 97 | 12 |
| 75-79 | 10,765 | 10,533 | 1,420 | 98 | 13 |
| 80+ | 13,233 | 12,472 | 1,994 | 94 | 16 |
From the above table what we have noticed is the percentage of married women without child is highest among age range 20-24, followed by age range 25-29, and gradually this decreases with increasing age range. Age 20-22 can be safely assumed as planned for not having child, but later than this age range is left with some questions as posted in the article. Do couples in Manipur age range 23-29 really suffer from infertility. The data say so! Some couples may have planned to delay having child, still percentage should not be this high. We will know how other three states are doing from the below tables.
Breakdown of data by age intervals for Nagaland
| Age | Total women | Married women | 0 child | % of married women | % of married women with no child |
|---|---|---|---|---|---|
| 20-24 | 1,00,594 | 37,060 | 14,648 | 37 | 40 |
| 25-29 | 87,303 | 55,339 | 10,830 | 63 | 20 |
| 30-34 | 73,419 | 59,170 | 6,519 | 81 | 11 |
| 35-39 | 63,503 | 57,250 | 3,960 | 90 | 7 |
| 40-44 | 51,608 | 48,474 | 2,837 | 94 | 6 |
| 45-49 | 39,990 | 38,346 | 1,938 | 96 | 5 |
| 50-54 | 29,725 | 28,625 | 1,575 | 96 | 6 |
| 55-59 | 19,657 | 18,950 | 1,120 | 96 | 6 |
| 60-64 | 16,836 | 15,848 | 1,242 | 94 | 8 |
| 65-69 | 11,442 | 10,554 | 937 | 92 | 9 |
| 70-74 | 8,333 | 7,926 | 792 | 96 | 10 |
| 75-79 | 4,930 | 4,738 | 481 | 96 | 10 |
| 80+ | 6,406 | 5,975 | 719 | 93 | 12 |
Breakdown of data by age intervals for Meghalaya
| Age | Total women | Married women | 0 child | % of married women | % of married women with no child |
|---|---|---|---|---|---|
| 20-24 | 1,45,872 | 87,106 | 26,183 | 60 | 30 |
| 25-29 | 1,26,605 | 1,02,721 | 17,395 | 81 | 17 |
| 30-34 | 93,871 | 84,368 | 10,094 | 90 | 12 |
| 35-39 | 87,386 | 83,465 | 8,057 | 96 | 10 |
| 40-44 | 72,073 | 69,256 | 6,264 | 96 | 10 |
| 45-49 | 60,072 | 58,335 | 5,282 | 97 | 10 |
| 50-54 | 42,833 | 41,622 | 4,167 | 97 | 10 |
| 55-59 | 29,417 | 28,615 | 3,124 | 97 | 11 |
| 60-64 | 25,287 | 24,213 | 3,026 | 96 | 12 |
| 65-69 | 18,292 | 17,302 | 2,555 | 95 | 15 |
| 70-74 | 12,537 | 12,076 | 1,869 | 96 | 15 |
| 75-79 | 6,997 | 6,816 | 1,073 | 97 | 16 |
| 80+ | 8,850 | 8,258 | 1,464 | 93 | 18 |
Breakdown of data by age intervals for Tripura
| Age | Total women | Married women | 0 child | % of married women | % of married women with no child |
|---|---|---|---|---|---|
| 20-24 | 1,89,398 | 1,33,904 | 33,090 | 70 | 25 |
| 25-29 | 1,69,090 | 1,49,646 | 17,737 | 89 | 12 |
| 30-34 | 1,37,758 | 1,30,256 | 9,800 | 95 | 8 |
| 35-39 | 1,36,291 | 1,32,231 | 7,620 | 97 | 6 |
| 40-44 | 1,14,658 | 1,12,246 | 6,130 | 98 | 5 |
| 45-49 | 98,752 | 97,144 | 5,068 | 98 | 5 |
| 50-54 | 75,559 | 74,446 | 4,014 | 99 | 5 |
| 55-59 | 55,025 | 54,307 | 3,046 | 99 | 6 |
| 60-64 | 47,518 | 46,889 | 2,980 | 99 | 6 |
| 65-69 | 35,436 | 35,014 | 2,399 | 99 | 7 |
| 70-74 | 26,789 | 26,543 | 2,029 | 99 | 8 |
| 75-79 | 15,827 | 15,692 | 1,244 | 99 | 8 |
| 80+ | 22,054 | 21,414 | 1,987 | 97 | 9 |
To further summarise, I will sum the numbers of Total women, Married women and 0 child from age range 20-34 i.e. the first three age ranges and calculate the percentage once again. These age ranges are the prime age for fertility.
| State | Age | Total women | Married women | 0 child | % of married women | % of married women with no child |
|---|---|---|---|---|---|---|
| Manipur | 20-34 | 3,91,060 | 2,32,288 | 59,728 | 59 | 26 |
| Nagaland | 20-34 | 2,61,316 | 1,51,569 | 31,997 | 58 | 21 |
| Meghalaya | 20-34 | 3,66,348 | 2,74,195 | 53,672 | 75 | 20 |
| Tripura | 20-34 | 4,96,246 | 4,13,806 | 60,627 | 83 | 15 |
As expected, Manipur is highest in infertility among the four states and Tripura is doing best. 83% women are married and women with no child is only 15% in Tripura.
Lets check for the entire northeast states. Instead of putting up dull looking table again and again, I will show the data in plot. The plot will interpret the number at first glance.
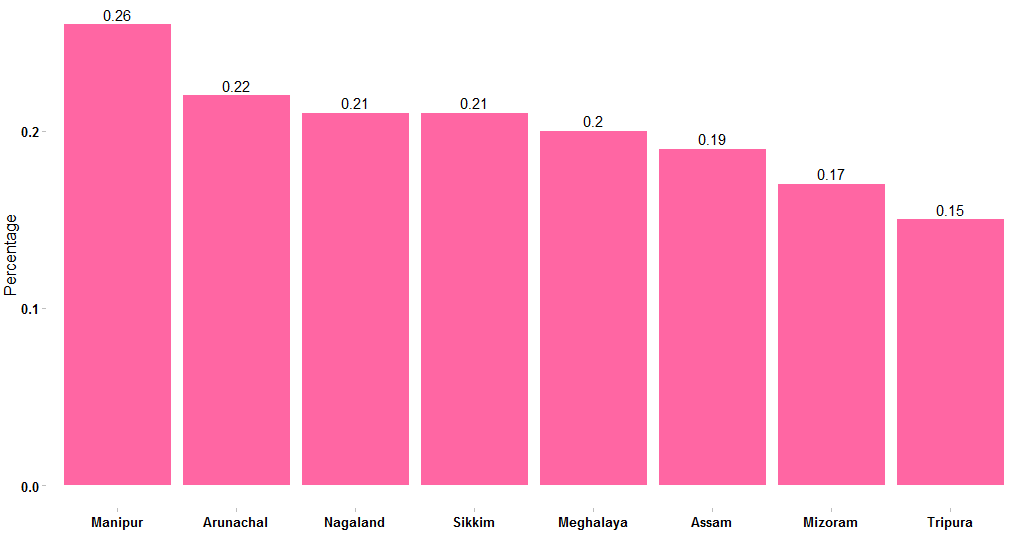
The number sitting on top of each bar is the percentage of married women with no child for age range 20-34, and Manipur is highest among the northeast states. I want to see where does Manipur stand in India. Do we have the highest percentage of married women with no child in the country. If that’s the case then, it’s time for the concern department to fix this.
Here is the plot for all India.
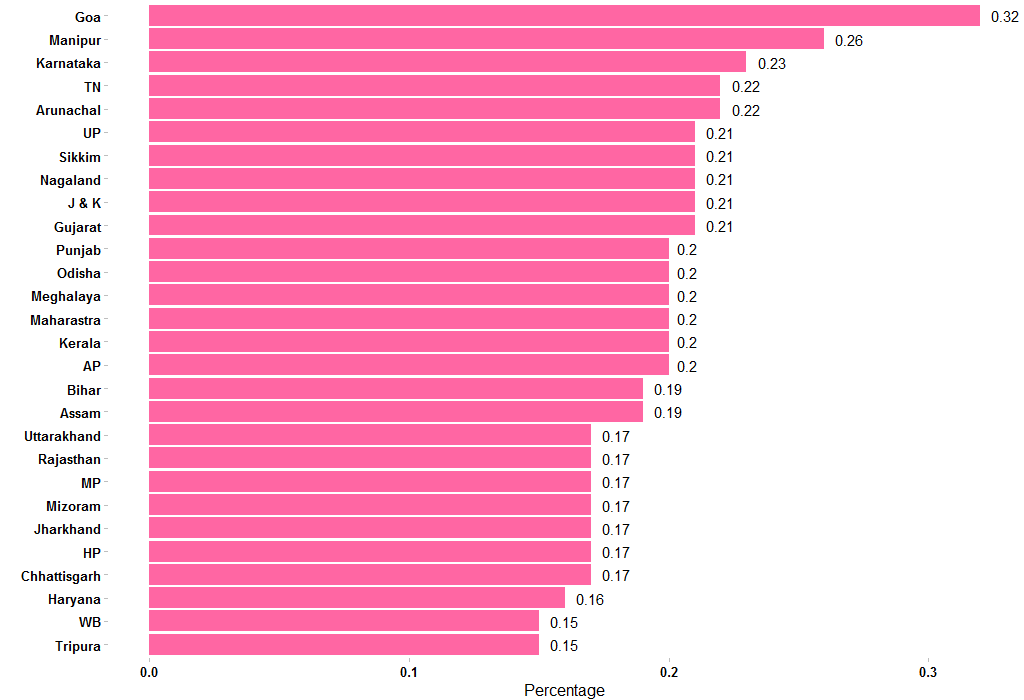
Something is not right with Goa and Manipur!
How about fertility rate in Manipur by religious communities? Is fertility somehow relate to certain communities nature or behaviour. Lets check that also.
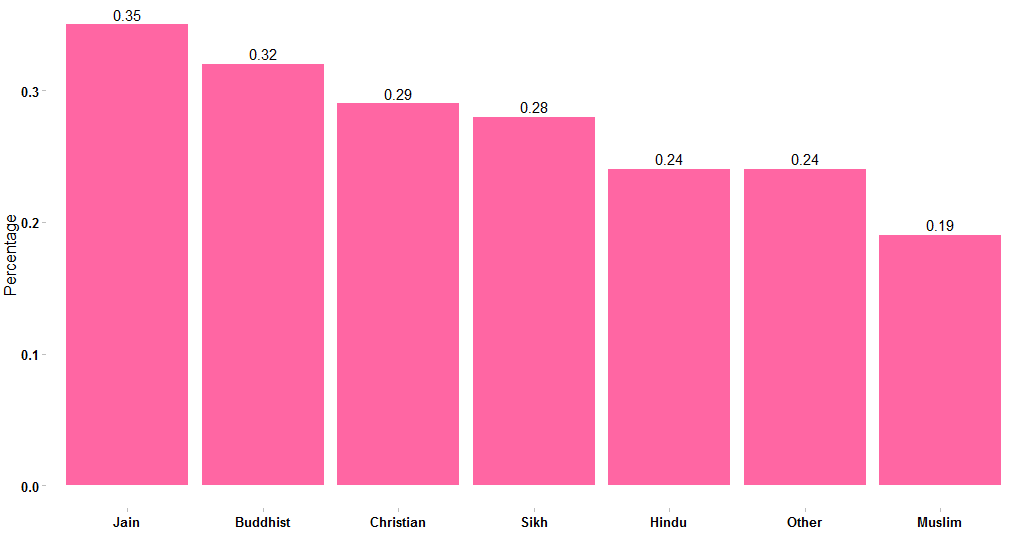
Among the religious communities, percentage of muslim married women with no child is the lowest. We can ignore other religious communities like Jain, Sikh and Buddhist because their population is less compare to Hindu, Other, Christian and Muslim. If we ignore Jain and Buddhist, then percentage of married women with no child in the age range 20-34 is highest in Christian community.
The fertility data is further categorised by education level as well.
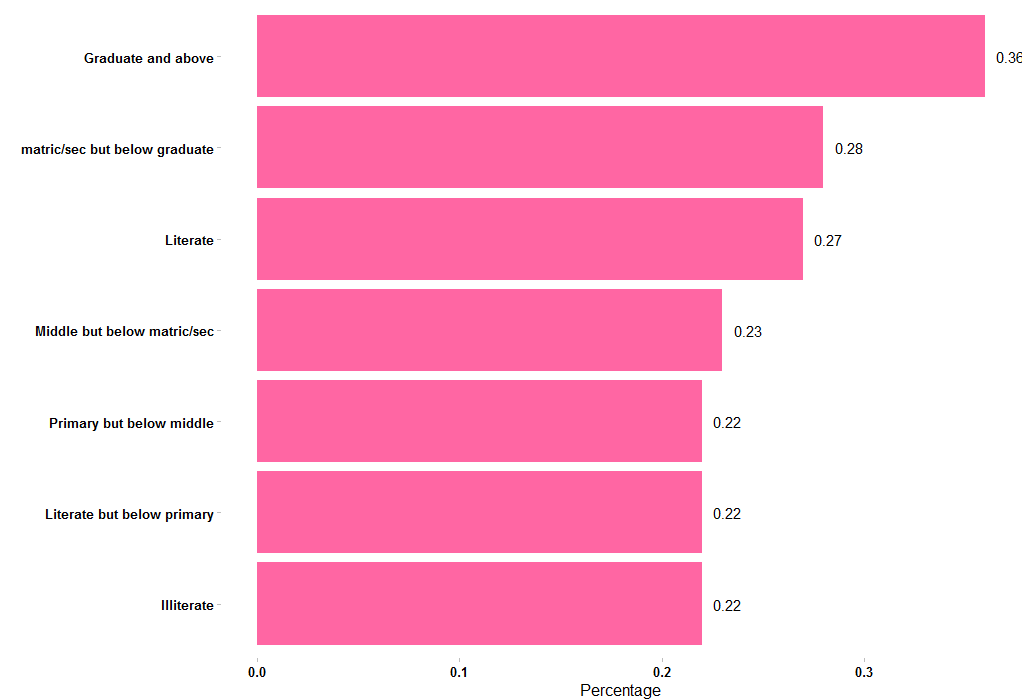
The percentage of married women with no child is highest among the graduate and above. May be gaining more educational knowledge brought the idea of family planning but no child at all is little advance thought in my opinion.
I don’t want to go on and on. I will end this with one last plot. The plot to see whether percentage of married women with no child is highest among urban or rural. Even before I see the data, even before I make the plot, I assume it is high in urban women population compare to rural. Lets see whether my assumption is wrong!
And it is WRONG! It doesn’t matter whether a woman is from rural areas or urban areas, low fertility among married women age range 20-34 is same!
What I can conclude from this data is - something is wrong with Manipur’s fertility. Now, stress, food adulteration, various pollutions and food habit do impact overall health including fertility and this is true for all over India, but why the percentage of marrried women with no child is so high in Goa and Manipur than rest of the states in India. The article posted on kanglaonline do pointed some causes and a paragraph Advice from Doctor has a line which says “Try to get pregnant during optimal conceivable age”. If you look at the above plot which shows all India, Tripura is the lowest. If you look at the table of four states, Tripura’s married women percentage for age range 20-34 is 83% whereas Manipur’s is 59%. So one immediate suggestion is
Get married as early as possible and get pregnant as soon as possible!
I know it was boring, but thanks for reading till the end.
Update(23-05-2016)
The above summary was on 2011 census data. I realised it will be wise to see the 2001 and 1991 census data as well for the same. By looking at 20 years of data, we can at least know whether fertility rate was always low, constant or getting better. Note that I am taking only age range 20-34.
| Year | Total women | Married women | 0 child | % of married women | % of married women with no child |
|---|---|---|---|---|---|
| 1991 | - | 1,50,484 | 38,412 | - | 25.52 |
| 2001 | 2,89,135 | 1,69,147 | 41,957 | 58.50 | 24.80 |
| 2011 | 3,91,060 | 2,32,288 | 59,728 | 59.39 | 25.71 |
Total women population was not listed for 1991 census. Looking at the table above, we can tell percentage of married women with no child is fairly constant for the last 20 years.