After Bar plot and Line plot, third in the series is Scatterplot.
I am going to use the famous Diamonds dataset which comes with ggplot2 package for scatterplot example. We bring in the data first by the following script below.
require(ggplot2) # Load the package
data("diamonds") # Load the data
diamond <- diamonds # Assign to a new object
Let’s explore the dataset a bit.
> str(diamond)
Classes ‘tbl_df’, ‘tbl’ and 'data.frame':	53940 obs. of  10 variables:
 $ carat  : num  0.23 0.21 0.23 0.29 0.31 0.24 0.24 0.26 0.22 0.23 ...
 $ Cut    : Ord.factor w/ 5 levels "Fair"<"Good"<..: 5 4 2 4 2 3 3 3 1 3 ...
 $ color  : Ord.factor w/ 7 levels "D"<"E"<"F"<"G"<..: 2 2 2 6 7 7 6 5 2 5 ...
 $ clarity: Ord.factor w/ 8 levels "I1"<"SI2"<"SI1"<..: 2 3 5 4 2 6 7 3 4 5 ...
 $ depth  : num  61.5 59.8 56.9 62.4 63.3 62.8 62.3 61.9 65.1 59.4 ...
 $ table  : num  55 61 65 58 58 57 57 55 61 61 ...
 $ price  : int  326 326 327 334 335 336 336 337 337 338 ...
 $ x      : num  3.95 3.89 4.05 4.2 4.34 3.94 3.95 4.07 3.87 4 ...
 $ y      : num  3.98 3.84 4.07 4.23 4.35 3.96 3.98 4.11 3.78 4.05 ...
 $ z      : num  2.43 2.31 2.31 2.63 2.75 2.48 2.47 2.53 2.49 2.39 ...
>
So it has 53940 observations and 10 features. I am going to make a scatterplot of diamond price with relate to carat and cut of the diamond. Here’s the first basic scatterplot.
ggplot(diamond, aes(x = carat, y = price)) +
  geom_point()
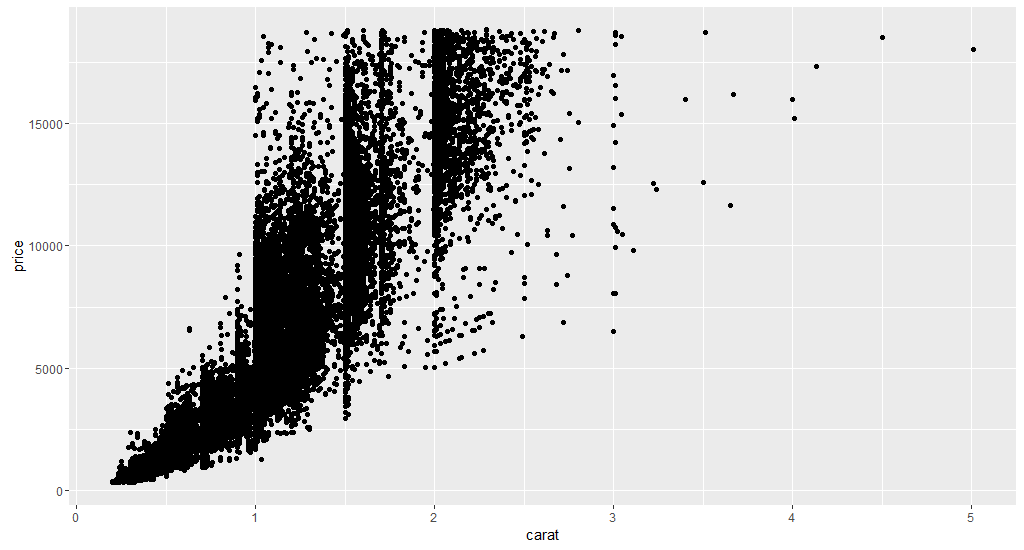
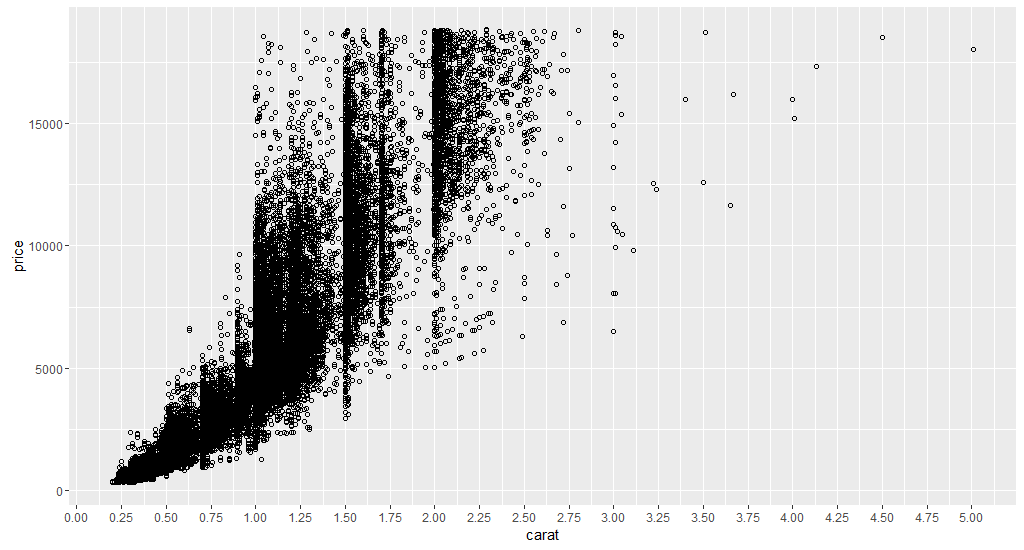
I am going to change the dark point into hollow point so that I can visualize the cut of the diamonds later.
ggplot(diamond, aes(x = carat, y = price)) +
  geom_point(shape = 21) ###

Scale of carat is from 0.2 to 5.01, and in the plot x-axis scale is from 1 to 5. I am going to break the x-axis scale into smaller part.
ggplot(diamond, aes(x = carat, y = price)) +
  geom_point(shape = 21) +
  scale_x_continuous(breaks = seq(0, 5, 0.25)) ###
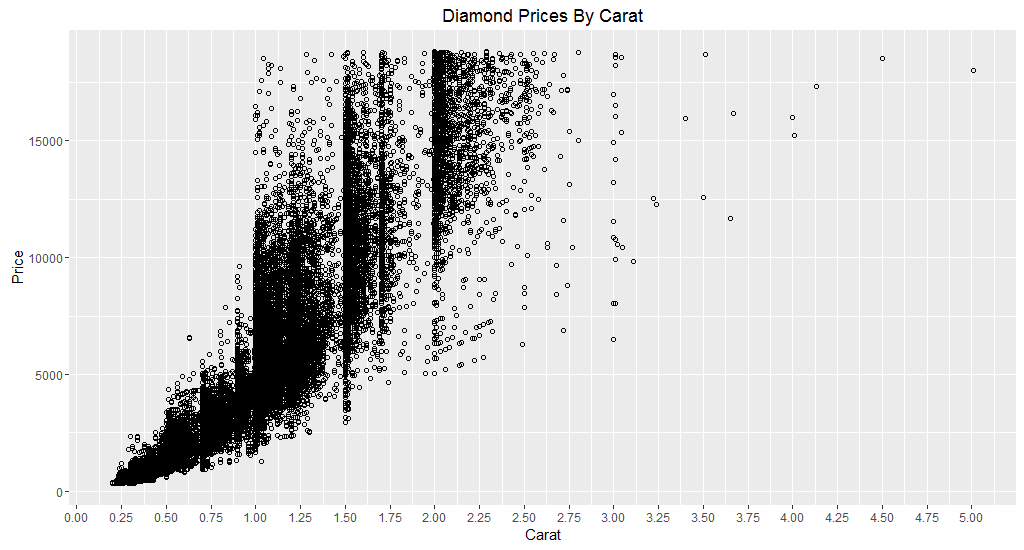
Adding plot title and axes titles.
ggplot(diamond, aes(x = carat, y = price)) +
  geom_point(shape = 21) +
  scale_x_continuous(breaks = seq(0, 5, 0.25)) +
  ggtitle("Diamond Prices By Carat") + ###
  labs(x = "Carat", y = "Price") ###
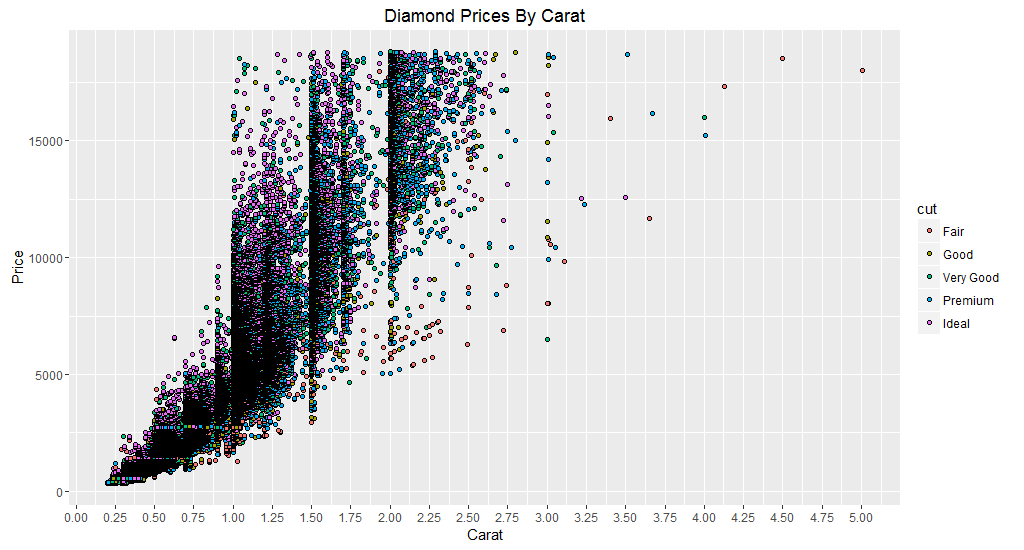
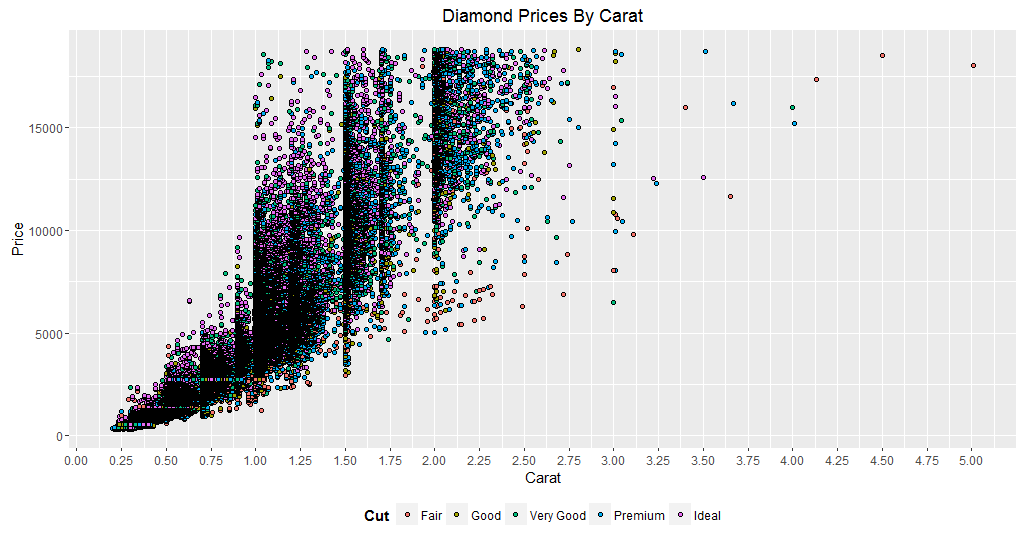
Let’s add cut feature as well in the plot.
ggplot(diamond, aes(x = carat, y = price, fill = Cut)) + ###
  geom_point(shape = 21) +
  scale_x_continuous(breaks = seq(0, 5, 0.25)) +
  ggtitle("Diamond Prices By Carat") +
  labs(x = "Carat", y = "Price")
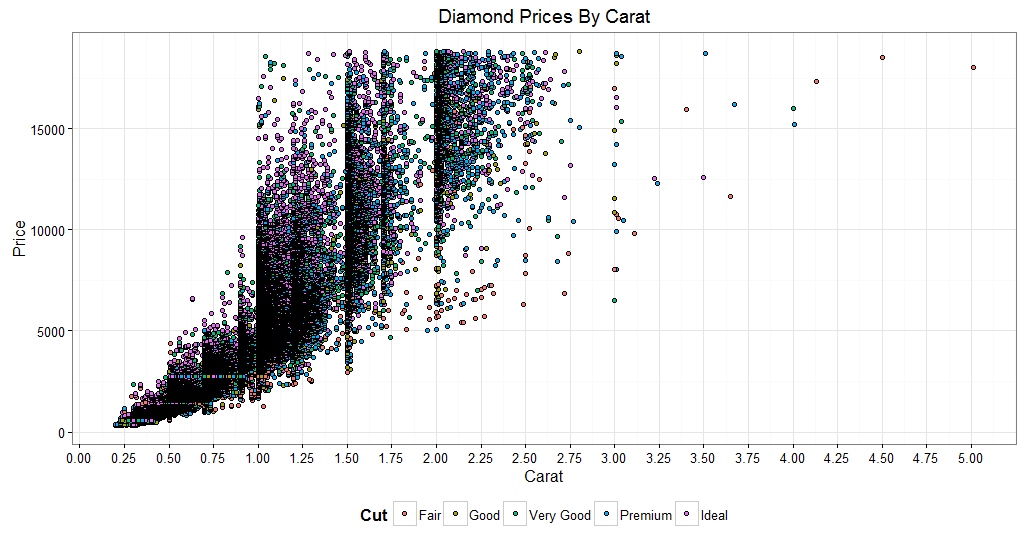
The title of the legend is in small. I want to make the first letter capital and bold. Also move the legend to my favorite area of the plot - bottom and in horizontal direction.
names(diamond)[2] <- "Cut" # Change the name of the feature from 'cut' to 'Cut'
ggplot(diamond, aes(x = carat, y = price, fill = Cut)) +
  geom_point(shape = 21) +
  scale_x_continuous(breaks = seq(0, 5, 0.25)) +
  ggtitle("Diamond Prices By Carat") +
  labs(x = "Carat", y = "Price") +
  theme(legend.position = "bottom", ###
        legend.direction = "horizontal", ###
        legend.title = element_text(face = "bold")) ###
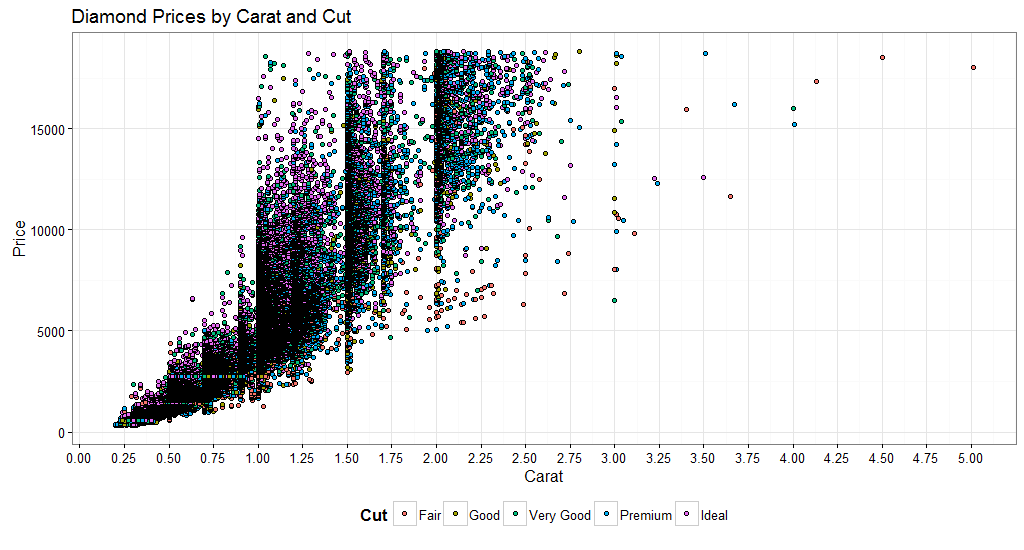
Change the background of the plot from grey to white.
ggplot(diamond, aes(x = carat, y = price, fill = Cut)) +
  geom_point(shape = 21) +
  scale_x_continuous(breaks = seq(0, 5, 0.25)) +
  ggtitle("Diamond Prices By Carat") +
  labs(x = "Carat", y = "Price") +
  theme_bw() + ###
  theme(legend.position = "bottom",
        legend.direction = "horizontal",
        legend.title = element_text(face = "bold"))
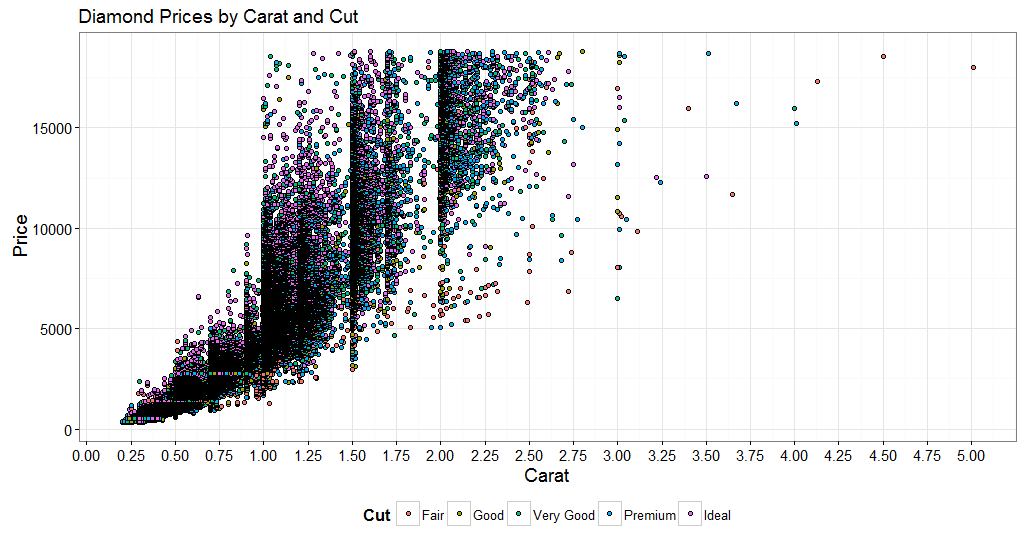
I want to move the position of the title towards extreme left.
ggplot(diamond, aes(x = carat, y = price, fill = Cut)) +
  geom_point(shape = 21) +
  scale_x_continuous(breaks = seq(0, 5, 0.25)) +
  ggtitle("Diamond Prices by Carat and Cut") +
  labs(x = "Carat", y = "Price") +
  theme_bw() +
  theme(legend.position = "bottom",
        legend.direction = "horizontal",
        legend.title = element_text(face = "bold"),
        plot.title = element_text(hjust = -0.002)) ###
I am going to increase the fonts of axis titles and labels.
ggplot(diamond, aes(x = carat, y = price, fill = Cut)) +
  geom_point(shape = 21) +
  scale_x_continuous(breaks = seq(0, 5, 0.25)) +
  ggtitle("Diamond Prices by Carat and Cut") +
  labs(x = "Carat", y = "Price") +
  theme_bw() +
  theme(legend.position = "bottom",
        legend.direction = "horizontal",
        legend.title = element_text(face = "bold"),
        plot.title = element_text(hjust = -0.002),
        axis.text = element_text(size = 11), ###
        axis.title = element_text(size = 14)) ###
Remove the minor grid lines from plot.
ggplot(diamond, aes(x = carat, y = price, fill = Cut)) +
  geom_point(shape = 21) +
  scale_x_continuous(breaks = seq(0, 5, 0.25)) +
  ggtitle("Diamond Prices by Carat and Cut") +
  labs(x = "Carat", y = "Price") +
  theme_bw() +
  theme(legend.position = "bottom",
        legend.direction = "horizontal",
        legend.title = element_text(face = "bold"),
        plot.title = element_text(hjust = -0.002),
        axis.text = element_text(size = 11),
        axis.title = element_text(size = 14),
        panel.grid.minor = element_blank()) ###

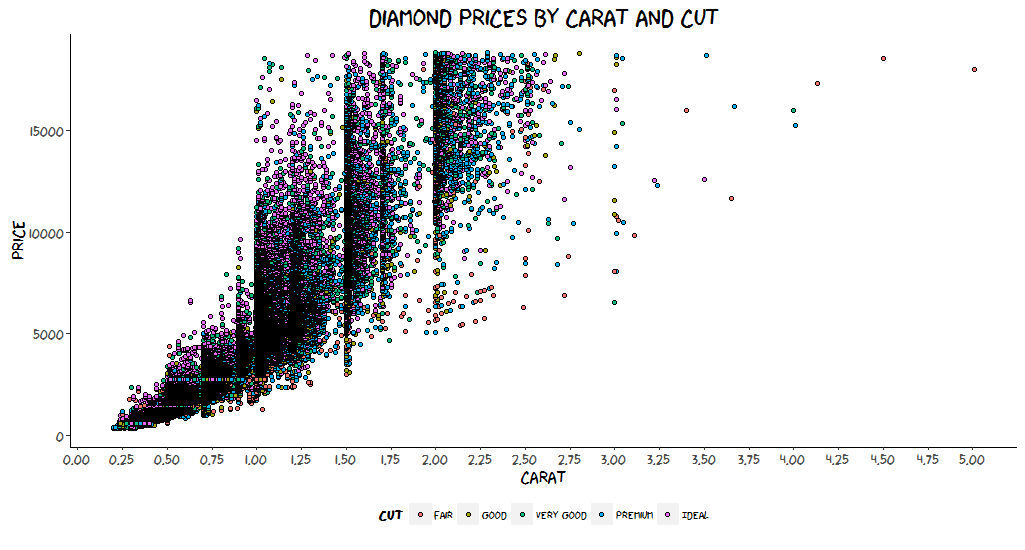
In XKCD style
require(extrafont) # For xkcd font

windowsFonts(xkcd=windowsFont("xkcd")) ###
ggplot(diamond, aes(x = carat, y = price, fill = Cut)) +
  geom_point(shape = 21) +
  scale_x_continuous(breaks = seq(0, 5, 0.25)) +
  ggtitle("Diamond Prices by Carat and Cut") +
  labs(x = "Carat", y = "Price") +
  theme(legend.position = "bottom",
        legend.direction = "horizontal",
        legend.title = element_text(face = "bold"),
        plot.title = element_text(size = 20, family = "xkcd"), ###
        axis.text = element_text(size = 11),
        axis.title = element_text(size = 14),
        text = element_text(family = "xkcd"), ###
        panel.background = element_blank(), ###
        axis.line.x = element_line(size = .5, colour = "black"), ###
        axis.line.y = element_line(size = .5, colour = "black")) ###
Resources
Thanks for reading out till the end and I hope this will help you to create your scatterplots with ease.